How We Calculate Overflights

An aircraft flies within the analysis cone and is successfully counted

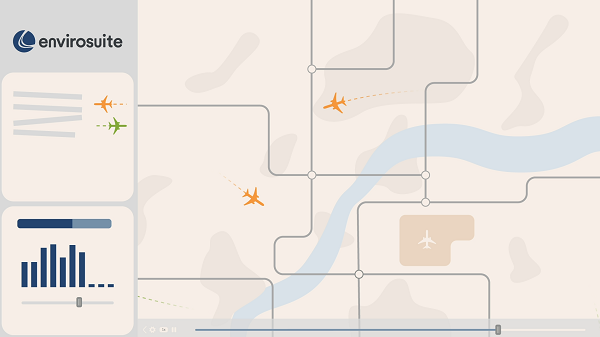
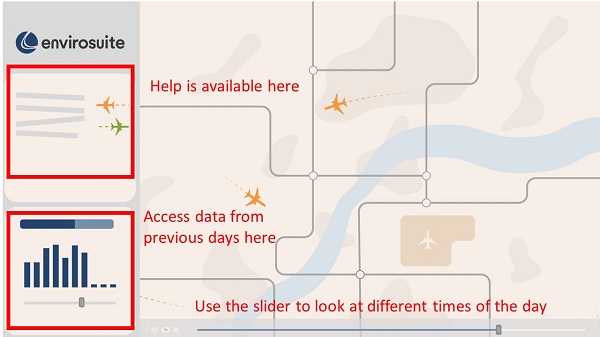
The following video explains how our system calculates location-specific data used on this website:

A cone extending up from the 800m underground to 10,000ft to show the areas which we calculate overflights

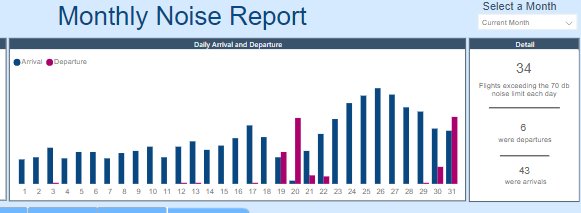
How we count the number of flights

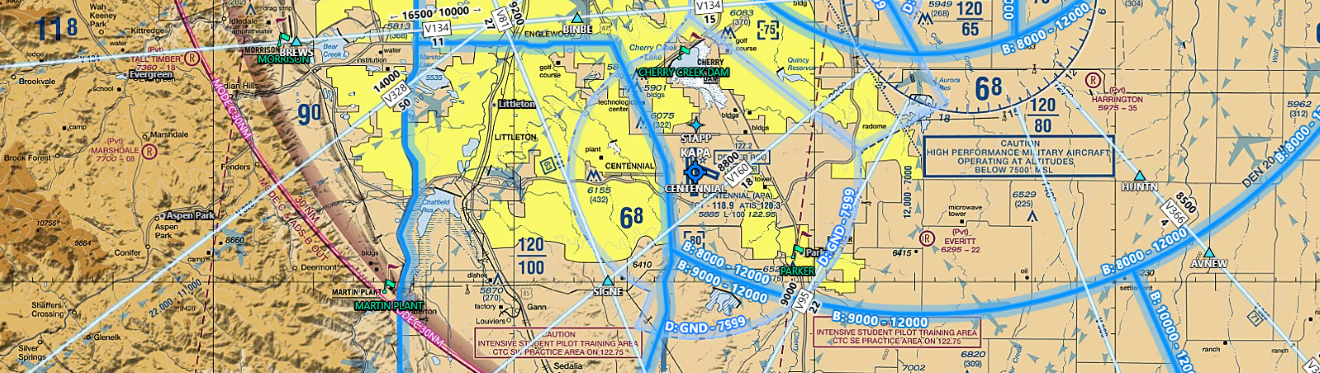
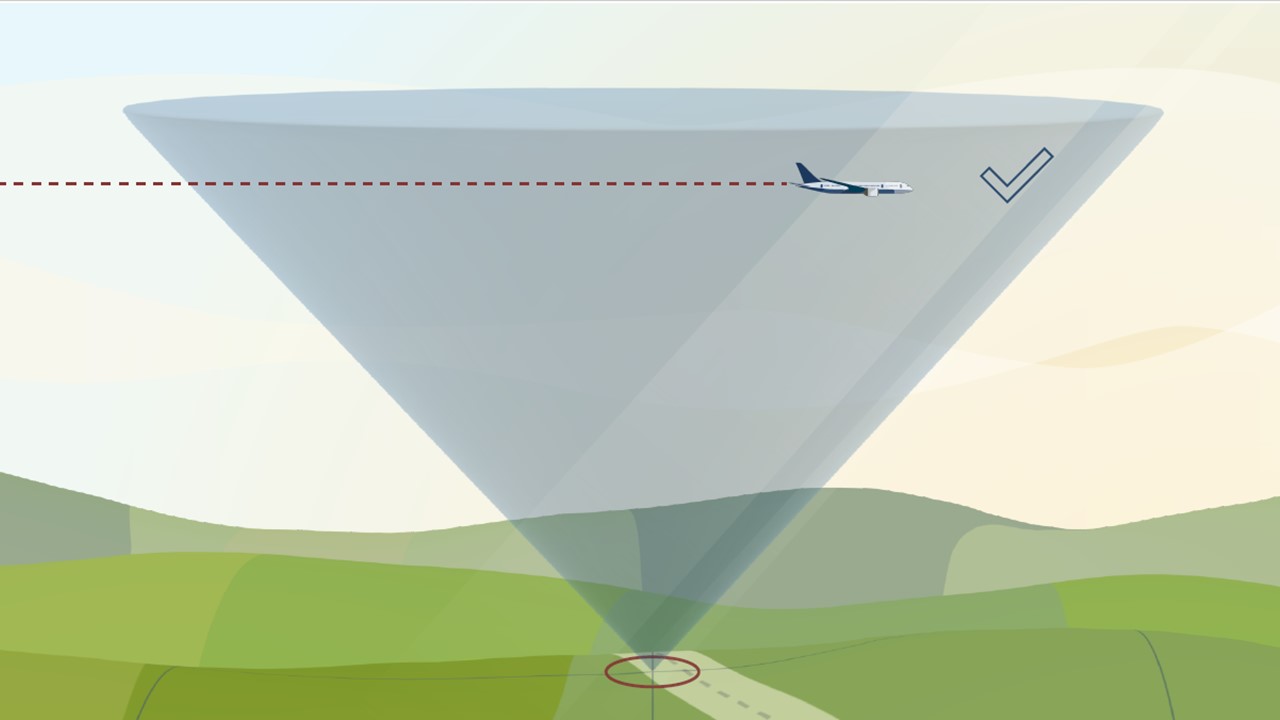
To be able to analyze the number of flights over an area around the airport, we have created a grid of identically sized squares. We start by drawing a cone at the corner of each grid. Using the location that you provided when you entered the site, we determine the nearest cone to you.

Flights that pass through each cone are recorded and that data is presented on this website.

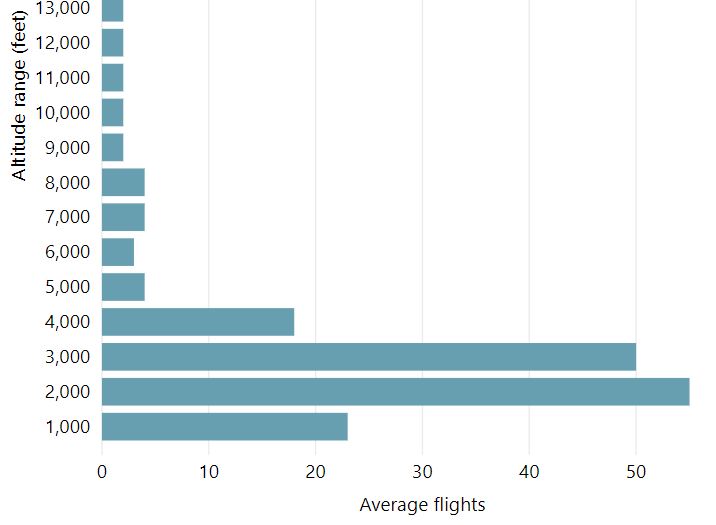
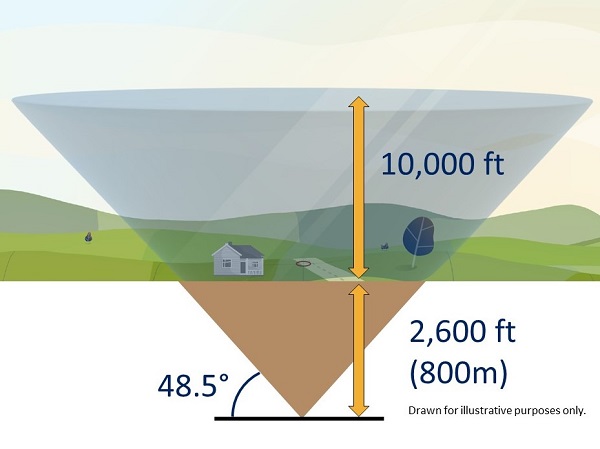
To avoid underestimating the flights in each area and to fully cover all locations in our grid, we lower the cone 2,600 feet into the ground. The cone extends up to 10,000 feet above local ground level and at the very top.

Why we use a cone

The 48.5-degree angle of the cone was selected as it incorporates an evaluation of noise, in that if one aircraft flew directly above the observer, followed by a second aircraft off to the side along the 48.5 degree line, the second aircraft would be 3 decibels quieter than the first.

Where does the data come from?

All data used in our system comes directly from our Aircraft Noise and Operations Monitoring System (ANOMS), which receives flight data from air traffic control radar.

How Frequent are Flights in My Area

How High are Flights in My Area

A depiction of a chart showing how many flights have flown the area in 1,000ft vertical bands

The altitude of aircraft can vary due to a number of factors. It could depend which airport the flight is going to or from, and whether it is an arrival or departure. Arrivals are typically following a steady descent to the runway while departures are typically following a steeper path as they climb away from the runway.

A core function of Air Traffic Control (ATC) is safety, and one of the primary ways in which this is achieved is by maintaining either lateral or vertical distances between aircraft. When close to airports, lateral separation is used, but when at higher altitudes, vertical separation is used with aircraft typically separated by around 1,000ft. This can sometimes be seen in the overflight data for your area.

This chart shows the height of aircraft overflying your area in 1,000ft increments. Mouse over it for more figures and detail. A dropdown menu allows you to view historical months for comparison and trends. The data is refreshed monthly, generally in the middle of the month.

The data shown is specific to your selected location and does not represent total airport operations.

Detailed Dashboard for your Area

Pulling together much of the other panels for frequency of flights, regularity, and altitude, this detailed dashboard compiles it all into one space for your review.

Additionally here, we include aircraft category – what general kind of aircraft they are, whether this is small civil aviation (propeller driven), or business jet, helicopter, commercial jet, or even military or emergency.

Information regarding the source of the overflight is also displayed, which is especially useful if there are more than one airport in your local area. It can be enlightening to learn that a noise disturbance was caused by operations are a different airport than was assumed.

How Many Aircraft Fly Near My Area

The following chart demonstrates local air traffic around your area—total flights per day for the month. The number and type of flights over your location can vary, even on different days, which is driven primarily by wind direction.

Mousing over the chart will give you detailed figures. Historical flights from previous months are available via a drop-down. The data is refreshed monthly with new data available typically in the middle of each month. Please keep this in mind as the most recent datasets may only be partially complete.

The Noise Monitoring Data

Everyone encounters sound every day. It is only when that sound causes an adverse effect on a listener, such as annoyance, does that sound become noise. And noise is not always just about how loud the sound is, there is a complex set of factors that drive annoyance both based upon the noise itself and what that noise means to us. You can find out more in the following video:

To understand the noise impact on the local community the airport has a number of fixed or temporary noise monitors deployed in the local area, generally under or near flight paths. The monitors detect and send the noise levels, every second 24 hours a day, 7 days a week, to a central system.

A ‘noise event’ is created when the monitor detects noise exceeding the background or local noise level for an appreciable amount of time. This could be due to any number of factors, be it local birds, cars or an aircraft. By continuously monitoring the noise level and integrating data from Air Traffic Control (ATC) our systems can determine if the noise event was generated by an aircraft, or another source.

The data collected by the monitors is presented in the following dashboard, which you can access and use by initially selecting a monitoring location in the top left. This will update all of the data for that monitoring location and will display the number of arrivals and departures detected at that location shown at the top. Additional analytics available at the bottom showing:

The dashboard is automatically updated every month and you can access data from previous months using the drop-down.

Find a Particular Flight

Introduction

WebTrak is our online flight tracker which provides the aircraft flight number, aircraft type, its altitude and track.

The web app uses data taken directly from air traffic control (ATC) radar. This is the same data that ATC use to safely manage aircraft in the sky. It is fed directly into the Airport Noise Monitoring and Management System (ANOMS) which powers the flight tracking systems.

We also show aircraft which do not operate from our airport. You can see aircraft arriving and departing, operations from other airports nearby, as well as the data direct from our fleet of noise monitors.

Please note: A small delay is applied to the replay of ‘live’ data to ensure all data is presented as accurately as possible.

How to use WebTrak

Showing where the help can be found (top left) in webtrak, where historical data can be found (bottom left) and how to move time (slider at bottom)

WebTrak allows you to both investigate flights above your area in near real-time as well as investigating historical data. There is lots of online help contained in the app (available through the menu on the left hand side of the screen) to help you understand the icons and method of operation. But to summarize some of the key features, you can:

I can’t see the flight that disturbed me

WebTrak takes a feed directly from Air Traffic Control (ATC) and while we aim to display all flights, you may notice that some are missing. This could be due to a number of reasons including: