This is the report archive, where you can find the archived reports that we have produced and shared with the community.
Report Archive


This portal aims to provide interactive information about flights utilizing the airport and how they may impact the local community. The portal is structured around the questions we commonly get asked, with location-specific statistics and content to help provide answers. You can enter an address or select a spot on the map to tailor this data. Alternatively, you can browse the portal without entering your location using the default location option.
This is the report archive, where you can find the archived reports that we have produced and shared with the community.
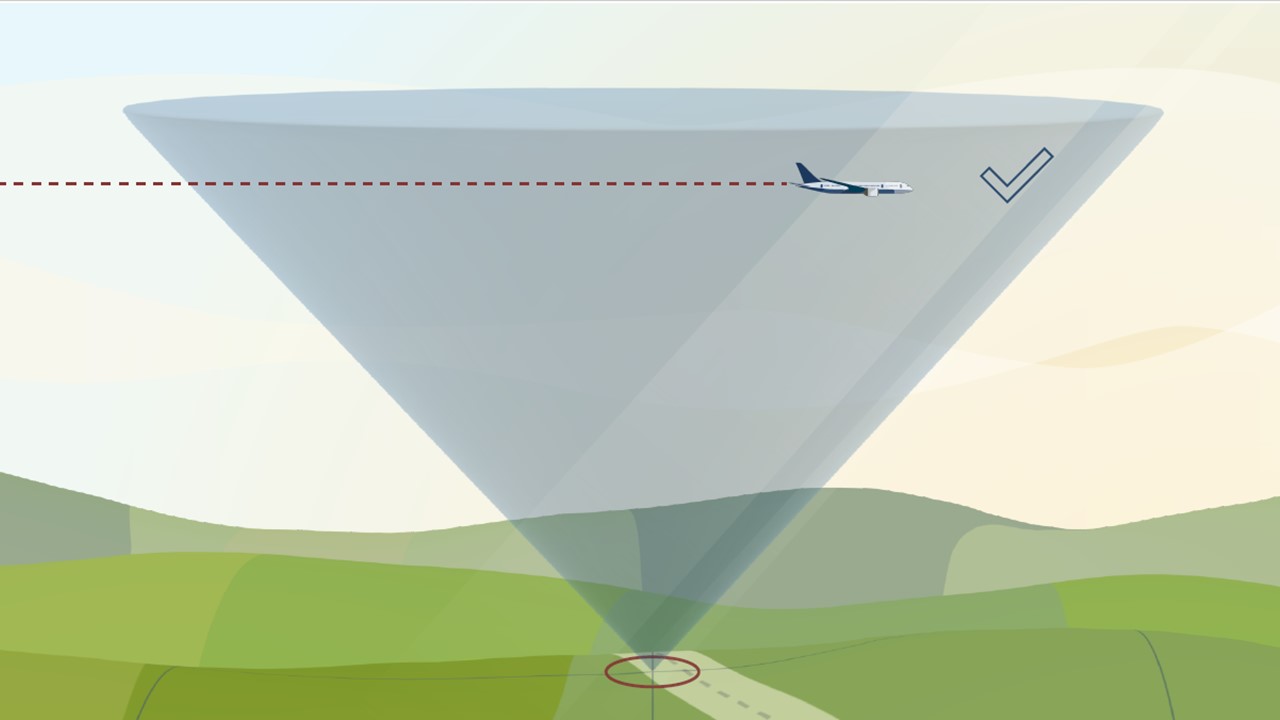
The following video explains how our system calculates location-specific data used on this website:
To be able to analyze the number of flights over an area around the airport, we have created a grid of identically sized squares. We start by drawing a cone at the corner of each grid. Using the location that you provided when you entered the site, we determine the nearest cone to you.
Flights that pass through each cone are recorded and that data is presented on this website.
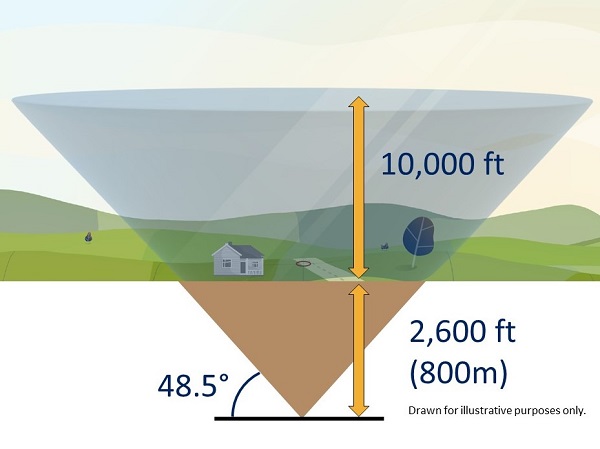
To avoid underestimating the flights in each area and to fully cover all locations in our grid, we lower the cone 2,600 feet into the ground. The cone extends up to 10,000 feet above local ground level and at the very top.
The 48.5-degree angle of the cone was selected as it incorporates an evaluation of noise, in that if one aircraft flew directly above the observer, followed by a second aircraft off to the side along the 48.5 degree line, the second aircraft would be 3 decibels quieter than the first.
All data used in our system comes directly from our Aircraft Noise and Operations Monitoring System (ANOMS), which receives flight data from air traffic control radar.

This portal and our flight tracking tools are designed to help you investigate on your own; however, we understand that not all questions may be answered. We are happy to address your inquiries and to receive any complaints regarding aircraft disturbances.
You can submit questions, enquiries and complaints to us via a number of methods including:
Once received, the airport will investigate your submission and respond if requested.
For a Noise Complaint to be considered valid:
Noise is unwanted sound that can cause disturbance or annoyance. Aircraft noise comes from airflow around the fuselage and wings, and especially from engines—loudest just behind them and during takeoff.
The way aircraft noise is experienced depends on factors like flight phase (arrival, departure, training), altitude, distance from the observer, and weather, which can influence both noise levels and runway use. Local background noise also affects perception—busy urban areas may mask aircraft noise, while quiet areas make it more noticeable. Annoyance is subjective, but airports actively monitor and report noise levels.
Modern aircraft are about 90% quieter than those from the 1960s.
Centennial Airport is one of the busiest airports in the country, and while the airport contributes more than $2.4 billion in economic impact to the area, the Arapahoe County Public Airport Authority works diligently to balance the needs of the airport with those of the surrounding community.
When buying a new home, there are many things to be considered. Location is one of very high importance. Prospective home buyers should be informed, consumers. Before you consider buying or renting a home near the airport, if you feel you may be sensitive to the noise, we encourage you to talk with your potential new neighbors and spend time near the property, during peak takeoff and landing times. If possible, visit the property at night (during the times you would most likely be sleeping) to better evaluate how the noise may affect you.
Keep in mind that many people who live in the area may not be as sensitive to noise as you, so it’s important to experience it first-hand. Centennial Airport staff are happy to visit with you and show you detailed maps of flight patterns that can help you make a more informed decision. The same goes for those individuals considering purchasing property for investment.
Centennial Airport has a variety of noise monitoring systems and tools, and can also run statistics on overflights to help guide your decision to reside near the airport.
In the 1950’s before the surrounding area was developed, George M. Wallace began laying the groundwork for what has become one of the nation’s most prominent business parks — the Denver Tech Center (DTC). Recognizing the critical role an airport plays in supporting such a thriving economic center, Wallace emphasizes the importance of aviation access to the DTC’s success.
On May 12th, 1968, Centennial Airport (formally Arapahoe Public Airport) opened. At the time, Arapahoe Road was only a two-lane dirt road leading to the Airport. Since then, the DTC has grown significantly, and with it, so has residential development and supporting facilities. Centennial Airport continues to work with the surrounding jurisdictions to establish compatible land use surrounding the airport.
Under Title 49 of the United States Code, and in accordance with the Federal Aviation Act, federally funded airports like Centennial are required to accommodate military operations as part of the national defense infrastructure. This access ensures that: 1) Joint civil-military use of airspace and airports supports national security; 2) Military pilots and crews receive necessary training in diverse environments; 3) Defense and emergency missions can be launched or supported rapidly.
Centennial Airport is open for business 24 hours a day, seven days a week, and in most weather conditions, with most of the traffic concentrated during the daytime hours. Under Title 49 of the United States Code (U.S.C.), Subtitle VII, Part B, Chapter 471, airports that accept federal grants are required to remain open to all types of aeronautical activity without unjust discrimination and must operate continuously unless closed for emergencies or maintenance.
In the 1950’s before the surrounding area was developed, George M. Wallace began laying the groundwork for what has become one of the nation’s most prominent business parks — the Denver Tech Center (DTC). Recognizing the critical role an airport plays in supporting such a thriving economic center, Wallace emphasizes the importance of aviation access to the DTC’s success.
On May 12th, 1968, Centennial Airport (formally Arapahoe Public Airport) opened. At the time, Arapahoe Road was only a two-lane dirt road leading to the Airport. Since then, the DTC has grown significantly, and with it, so has residential development and supporting facilities. Centennial Airport continues to work with the surrounding jurisdictions to establish compatible land use surrounding the airport.
For safety and performance factors, aircraft must arrive and depart into the wind. Centennial Airport’s primary runways are angled with the predominant wind directions of north and south. During typical fair-weather days for the area around Centennial Airport, the wind direction is predominately from the south. This puts the airport in a “South Flow” configuration with aircraft arriving from the north and departing towards the south. During inclement weather days (low clouds, high winds, precipitation, etc.), the wind direction is predominantly from the north and the airport operates in a “North Flow” configuration with aircraft arriving and departing towards the north. Approximately 55 percent of the traffic at Centennial Airport arrives and departs the airport towards the south.
The areas immediately north and south of the airport experience very high volumes of aircraft traffic. Roughly, 85 percent of Centennial’s traffic uses the north/south runways. A number of smaller aircraft use the east/west crosswind runway as a means to keep separation from the larger jet traffic. Areas directly east of the airport are impacted by these operations.
Except for takeoff and landing maneuvers and emergency operations, the FAA’s general flight rules specify a minimum altitude of 1,000 feet over congested areas and 500 feet over non-congested areas. Within Centennial Airport’s airspace (5 miles surrounding the airport), aircraft may be in a climb or decent phase of flight and will likely be flying lower than 1,000 feet. Helicopters, law enforcement and military aircraft are not required to adhere to these rules.
In an odd “Catch-22,” the Airport Authority is responsible for addressing aircraft noise but has absolutely no control how and where the aircraft fly. Once the wheels of the aircraft leave the pavement, the aircraft is under the control of the Federal Aviation Administration Air Traffic Control. Safety is the #1 concern and keeping maximum separation between aircraft takes precedence over noise-related concerns.
Aviation is one of the most heavily regulated industries in the United States. The Federal Aviation Administration regulates everything from manufacturing of aircraft to flight rules and air traffic control in and out of airports. Because of this, aircraft travel remains the safest form of travel in the world. While aircraft accidents may be highly publicized, they are extremely rare with fewer than .07 deaths per billion passenger miles for aircraft versus 7.28 deaths per billion passenger miles for cars. (Source: Ian Savage, Northwestern University). The likelihood of an aircraft ground strike is many times smaller than getting hit by lightning or sustaining fatal injuries from a car accident.
Centennial Airport is committed to minimizing the impact of aircraft noise on our surrounding communities while maintaining safe and efficient operations. We take a multi-faceted approach to aircraft noise management, which includes:
Of all noise-control methods, Centennial Airport has the greatest influence over voluntary noise abatement procedures. Centennial Airport works closely with pilots, flight schools, and the Centennial Airport Community Noise Roundtable to publish voluntary procedures that help reduce the impact of aircraft noise on surrounding neighborhoods. While safety and air traffic control instructions always take priority, these measures are designed to make a meaningful difference in keeping operations quieter.
Pilots are encouraged to avoid flying over the most noise-sensitive areas whenever possible, to limit training flights and instrument practice between 10:00 p.m. and 7:00 a.m., and to make gradual power changes to avoid sudden bursts of noise. Signs posted at runway ends remind pilots of these quiet flying techniques. Because terrain rises south and west of the airport, pilots also adjust their flight paths and altitudes accordingly.
For smaller propeller aircraft touch-and-go operations are requested to be kept to 10 per flight. When conditions allow, pilots use Runway 10/28 to help route flights away from more populated areas, climbing quickly to safe altitudes and reducing engine power as soon as it is safe to do so. Jet operators follow National Business Aviation Association noise abatement procedures, use thrust reduction techniques after takeoff, and limit the use of reverse thrust when landing. Helicopter pilots coordinate with air traffic control to follow preferred noise-friendly routes.
Our Airport Noise and Operations Monitoring System (ANOMS) continuously tracks flights, collects noise data, and identifies trends. This information allows us to work with operators to address recurring issues, adjust procedures, and—when necessary—recommend changes to flight patterns or aircraft usage.
Centennial Airport is currently undergoing its second FAA Part 150 Noise Compatibility Study, a comprehensive review process designed to evaluate aircraft noise impacts on surrounding communities and recommend strategies for mitigation. The airport completed its first Part 150 study in 2008, followed by a Noise Exposure Map (NEM) update in 2016 to reflect changes in operations and community growth. This second study, which involves close collaboration with stakeholders, residents, and regulatory agencies, is expected to be completed in 2026, providing updated data and recommendations to help balance the airport’s operations with community concerns.
We recognize that an active airport will always generate noise, but through careful planning, continuous monitoring, and strong partnerships with pilots, operators, and local authorities, we work to keep noise levels as low as possible.

Centennial Airport plays a vital role in the Denver South region, serving as one of the busiest general aviation airports in the nation. It supports business aviation, flight schools, emergency services, and aerospace companies while enabling the movement of people, goods, and services across Colorado and the United States. The airport generates thousands of jobs, fuels significant local and regional economic activity, and provides essential aviation infrastructure.
Centennial Airport is committed to being a transparent and responsible neighbor in a complex environment surrounded by diverse communities. It actively engages with residents, businesses, airport tenants, training providers, and government officials to ensure operations align with long-term planning goals. Key to this engagement is the Centennial Airport Community Noise Roundtable (CACNR), a multi-jurisdictional committee that meets regularly to review operations, analyze noise data, share updates, and recommend mitigation strategies. Its subcommittee, the CACNR Study Group, focuses on technical and operational issues north of the airport, exploring noise reductions and operational compatibility.
To support public involvement, Centennial Airport offers a community portal with real-time and historical flight tracking, noise inquiry tools, and educational resources on flight operations. Residents can participate through open CACNR meetings, forums, and an online noise monitoring system that allows for transparent tracking and response to concerns. Through these efforts, Centennial Airport remains committed to responsible growth, operational excellence, and a collaborative relationship with its neighbors, ensuring both the airport and surrounding communities thrive together.
Centennial Airport’s flight frequency is shaped by several key factors:
The data shown is specific to your selected location and does not represent total airport operations.
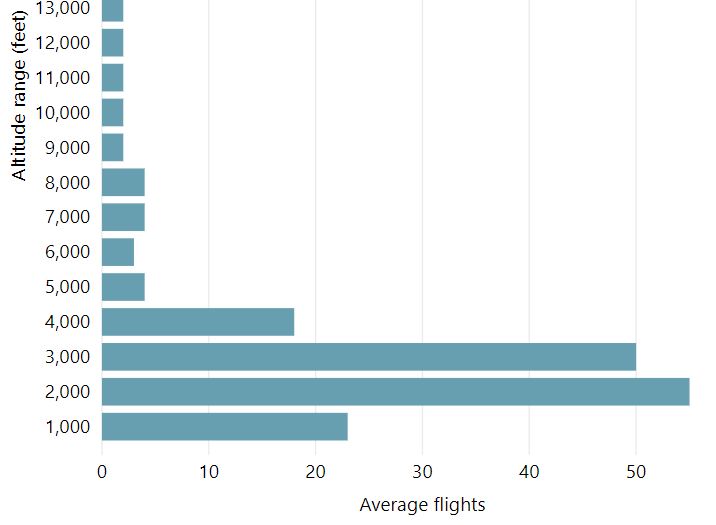
The altitude of aircraft can vary due to a number of factors. It could depend which airport the flight is going to or from, and whether it is an arrival or departure. Arrivals are typically following a steady descent to the runway while departures are typically following a steeper path as they climb away from the runway.
A core function of Air Traffic Control (ATC) is safety, and one of the primary ways in which this is achieved is by maintaining either lateral or vertical distances between aircraft. When close to airports, lateral separation is used, but when at higher altitudes, vertical separation is used with aircraft typically separated by around 1,000ft. This can sometimes be seen in the overflight data for your area.
This chart shows the height of aircraft overflying your area in 1,000ft increments. Mouse over it for more figures and detail. A dropdown menu allows you to view historical months for comparison and trends. The data is refreshed monthly, generally in the middle of the month.
The data shown is specific to your selected location and does not represent total airport operations.
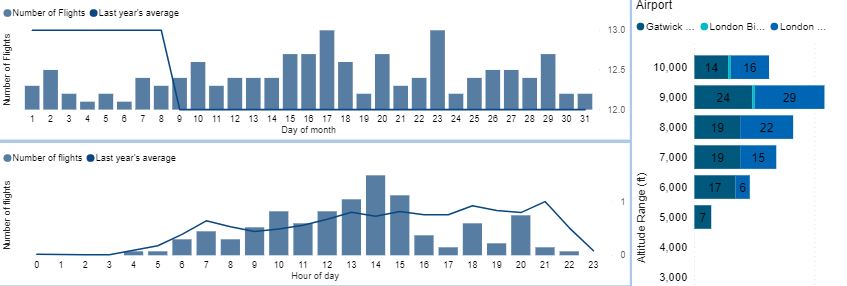
Pulling together much of the other panels for frequency of flights, regularity, and altitude, this detailed dashboard compiles it all into one space for your review.
Additionally here, we include aircraft category – what general kind of aircraft they are, whether this is small civil aviation (propeller driven), or business jet, helicopter, commercial jet, or even military or emergency.
Information regarding the source of the overflight is also displayed, which is especially useful if there are more than one airport in your local area. It can be enlightening to learn that a noise disturbance was caused by operations are a different airport than was assumed.
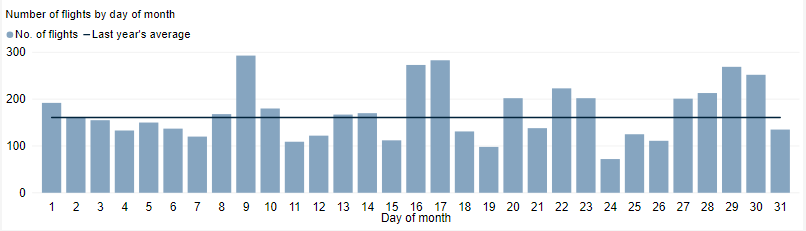
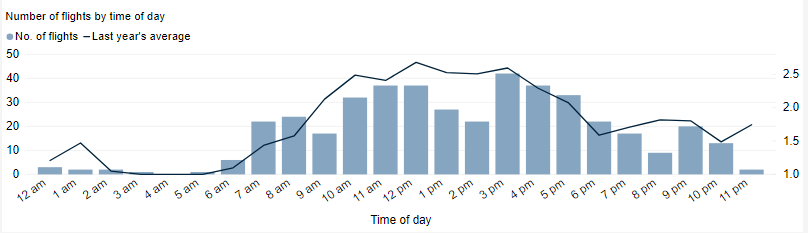
The following chart demonstrates local air traffic around your area—total flights per day for the month. The number and type of flights over your location can vary, even on different days, which is driven primarily by wind direction.
Mousing over the chart will give you detailed figures. Historical flights from previous months are available via a drop-down. The data is refreshed monthly with new data available typically in the middle of each month. Please keep this in mind as the most recent datasets may only be partially complete.
The data shown is specific to your selected location and does not represent total airport operations.
Centennial Airport Noise Hotline: 303-790-4709 | Submit Noise Complaint | Powered by 